Example of DOV search methods for groundwater screens (grondwaterfilters)
![]()
Use cases:
Get groundwater screens in a bounding box
Get groundwater screens with specific properties
Get the coordinates of all groundwater screens in Ghent
Get the ‘meetnet’ and ‘meetnet_code’ for groundwater screens in Boortmeerbeek
Get all details of groundwaterscreens of ‘meetnet 9’ within the given bounding box
Get groundwater screens based on a combination of specific properties
Get groundwater screens within a groundwater body
List yearly average water head levels (GxG)
[2]:
%matplotlib inline
import inspect, sys
[3]:
# check pydov path
import pydov
Get information about the datatype ‘GrondwaterFilter’
[4]:
from pydov.search.grondwaterfilter import GrondwaterFilterSearch
gwfilter = GrondwaterFilterSearch()
A description is provided for the ‘GrondwaterFilter’ datatype:
[5]:
print(gwfilter.get_description())
In de Databank Ondergrond Vlaanderen zijn verschillende grondwatermeetnetten opgenomen. Deze meetnetten staan in functie van uitgebreide monitoringprogramma’s met de bedoeling een goed beeld te krijgen van de beschikbare grondwaterkwantiteit en grondwaterkwaliteit van de watervoerende lagen in Vlaanderen.
The different fields that are available for objects of the ‘GrondwaterFilter’ datatype can be requested with the get_fields() method:
[6]:
fields = gwfilter.get_fields()

# print available fields
for f in fields.values():
    print(f['name'])
gw_id
pkey_grondwaterlocatie
filternummer
pkey_filter
namen
filtergrafiek
putgrafiek
Aquifer_HCOVv1
Aquifer_HCOVv2
diepte_onderkant_filter
lengte_filter
putsoort
filtertype
meetnet
x
y
start_grondwaterlocatie_mtaw
gemeente
grondwaterlichaam
afgesloten_volgens_gwdecreet
datum_in_filter
datum_uit_filter
stijghoogterapport
analyserapport
boornummer
boringfiche
peilmetingen_van
peilmetingen_tot
kwaliteitsmetingen_van
kwaliteitsmetingen_tot
recentste_exploitant
beheerder
aantal_dagen_sinds_laatste_meting
eerste_invoer
recentste_installatie
geom
meetnet_code
aquifer_code
grondwaterlichaam_code
regime
datum
tijdstip
peil_mtaw
betrouwbaarheid
methode
filterstatus
filtertoestand
mv_mtaw
Alternatively, you can list all the fields and their details by inspecting the get_fields() output or the search instance itself in a notebook:
[7]:
gwfilter
[7]:
In de Databank Ondergrond Vlaanderen zijn verschillende grondwatermeetnetten opgenomen. Deze meetnetten staan in functie van uitgebreide monitoringprogramma’s met de bedoeling een goed beeld te krijgen van de beschikbare grondwaterkwantiteit en grondwaterkwaliteit van de watervoerende lagen in Vlaanderen.
gw_id - Identificatie van de grondwaterlocatie. Dit veld was vroeger bekend als 'putnummer'.
- type: string
- notnull: True
- query: True
- cost: 1
- multivalue: False
pkey_grondwaterlocatie - URL die verwijst naar de gegevens van de grondwaterlocatie op de website. Voeg '.xml' toe om een XML voorstelling van deze gegevens te verkrijgen
- type: string
- notnull: True
- query: True
- cost: 1
- multivalue: False
filternummer - Het filternummer van de filter.
- type: string
- notnull: False
- query: True
- cost: 1
- multivalue: False
pkey_filter - URL die verwijst naar de gegevens van de filter op de website. Voeg '.xml' toe om een XML voorstelling van deze gegevens te verkrijgen. Wanneer dit veld leeg is betreft dit record een put zonder filters.
- type: string
- notnull: False
- query: True
- cost: 1
- multivalue: False
namen - Andere namen voor deze grondwaterlocatie
- type: string
- notnull: False
- query: True
- cost: 1
- multivalue: False
filtergrafiek - URL die verwijst naar een interactieve grafiek van de filter op de website. Wanneer dit veld leeg is betreft dit record een grondwaterlocatie zonder filters
- type: string
- notnull: False
- query: True
- cost: 1
- multivalue: False
putgrafiek - URL die verwijst naar een interactieve grafiek van alle filters van de grondwaterlocatie op de website.
- type: string
- notnull: True
- query: True
- cost: 1
- multivalue: False
Aquifer_HCOVv1 - None
- type: string
- notnull: False
- query: True
- cost: 1
- multivalue: False
Aquifer_HCOVv2 - None
- type: string
- notnull: False
- query: True
- cost: 1
- multivalue: False
diepte_onderkant_filter - De diepte van de onderkant van de filter (in meter, positief onder aanvangspeil put gegeven in attribuut Z_mTAW)
- type: float
- notnull: False
- query: True
- cost: 1
- multivalue: False
lengte_filter - De lengte van de filter (in meter).
- type: float
- notnull: False
- query: True
- cost: 1
- multivalue: False
putsoort - de soort grondwaterlocatie
- type: string
- notnull: True
- query: True
- cost: 1
- multivalue: False
- codelist:
Installatie - Installatie
batterijput - batterijput
bodemlus - bodemlus
bron, natuurlijke holte - bron, natuurlijke holte
bronbemaling - bronbemaling
draineringsinrichting - draineringsinrichting
galerij - galerij
graverij, mijn, groeve - graverij, mijn, groeve
niet-verbuisde boorput - niet-verbuisde boorput
onbekend - onbekend
ring- of steenput - ring- of steenput
verbuisde boorput - verbuisde boorput
vijver - vijver
filtertype - Het type van de filter. Wanneer dit veld leeg is betreft dit record een put zonder filters.
- type: string
- notnull: False
- query: True
- cost: 1
- multivalue: False
- codelist:
infiltratiefilter - infiltratiefilter
natuurlijke filter - natuurlijke filter
omkeerbare filter - omkeerbare filter
peilfilter - peilfilter
pompfilter - pompfilter
meetnet - Het meetnet waartoe de filter behoort.
- type: string
- notnull: False
- query: True
- cost: 1
- multivalue: False
- codelist:
meetnet 1 - primair meetnet - afdeling Water - meetnet 1 - primair meetnet - afdeling Water
meetnet 10 - rubriek 55 (verticale boringen) - meetnet 10 - rubriek 55 (verticale boringen)
meetnet 11 - rubriek 53.6 (koude-warmtepompen) - meetnet 11 - rubriek 53.6 (koude-warmtepompen)
meetnet 3 - tijdelijk meetnet - afdeling Water - meetnet 3 - tijdelijk meetnet - afdeling Water
meetnet 4 - externe instanties - meetnet 4 - externe instanties
meetnet 5 - peilputten drinkwatermaatschappijen - meetnet 5 - peilputten drinkwatermaatschappijen
meetnet 6 - peilputten individuele bedrijven - meetnet 6 - peilputten individuele bedrijven
meetnet 7 - winningsputten - meetnet 7 - winningsputten
meetnet 8 - freatisch meetnet - afdeling water - meetnet 8 - freatisch meetnet - afdeling water
meetnet 9 - peilputten INBO en natuurorganisaties - meetnet 9 - peilputten INBO en natuurorganisaties
onbekend - onbekend
x - De x-coördinaat van de put in het Lambert72 coördinaatsysteem (in meter, EPSG:31370).
- type: float
- notnull: True
- query: True
- cost: 1
- multivalue: False
y - De y-coördinaat van de put in het Lambert72 coördinaatsysteem (in meter, EPSG:31370).
- type: float
- notnull: True
- query: True
- cost: 1
- multivalue: False
start_grondwaterlocatie_mtaw - De hoogte van het aanvangspeil van de put in het TAW stelsel (in meter).
- type: float
- notnull: True
- query: True
- cost: 1
- multivalue: False
gemeente - De gemeente waarin de put gelegen is
- type: string
- notnull: False
- query: True
- cost: 1
- multivalue: False
grondwaterlichaam - Het grondwaterlichaam waarin de filter hangt. Als tekst, opgebouwd uit de afkorting en de naam gescheiden door " - "
- type: string
- notnull: False
- query: True
- cost: 1
- multivalue: False
afgesloten_volgens_gwdecreet - None
- type: string
- notnull: False
- query: True
- cost: 1
- multivalue: False
datum_in_filter - De datum wanneer de filter in gebruik genomen is
- type: date
- notnull: True
- query: True
- cost: 1
- multivalue: False
datum_uit_filter - De datum wanneer de filter uit gebruik genomen is
- type: date
- notnull: False
- query: True
- cost: 1
- multivalue: False
stijghoogterapport - URL die verwijst naar het stijghoogterapport van de grondwaterlocatie in PDF formaat.
- type: string
- notnull: True
- query: True
- cost: 1
- multivalue: False
analyserapport - URL die verwijst naar het analyserapport van de grondwaterlocatie in PDF formaat.
- type: string
- notnull: True
- query: True
- cost: 1
- multivalue: False
boornummer - Het boornummer (ook gekend als proefnummer) van de boring.
- type: string
- notnull: False
- query: True
- cost: 1
- multivalue: False
boringfiche - Permanente URL die verwijst naar de gegevens van de boring op de website. Voeg '.xml' toe om een XML voorstelling van deze gegevens te verkrijgen.
- type: string
- notnull: False
- query: True
- cost: 1
- multivalue: False
peilmetingen_van - Datum waarop de eerste peilmeting werd uitgevoerd.
- type: date
- notnull: False
- query: True
- cost: 1
- multivalue: False
peilmetingen_tot - Datum waarop de laatste peilmeting werd uitgevoerd.
- type: date
- notnull: False
- query: True
- cost: 1
- multivalue: False
kwaliteitsmetingen_van - Datum waarop het eerste grondwaterstaal op deze filter werd genomen
- type: date
- notnull: False
- query: True
- cost: 1
- multivalue: False
kwaliteitsmetingen_tot - Datum waarop het laatste grondwaterstaal op deze filter werd genomen.
- type: date
- notnull: False
- query: True
- cost: 1
- multivalue: False
recentste_exploitant - De recentste exploitant van een grondwaterlocatie (installatieput)
- type: string
- notnull: True
- query: True
- cost: 1
- multivalue: False
beheerder - De huidige beheerder van een grondwaterlocatie (meetnetput)
- type: string
- notnull: True
- query: True
- cost: 1
- multivalue: False
aantal_dagen_sinds_laatste_meting - None
- type: integer
- notnull: False
- query: True
- cost: 1
- multivalue: False
eerste_invoer - Het tijdstip waarop deze filter voor het eerst in DOV ingevoerd werd. In het geval van een grondwaterlocatie zonder filter: het tijdstip waarop deze grondwaterlocatie voor het eerst in DOV ingevoerd werd.
- type: datetime
- notnull: True
- query: True
- cost: 1
- multivalue: False
recentste_installatie - De unieke identificatie van de meest recente installatie waaraan deze grondwaterlocatie gekoppeld is.
- type: string
- notnull: False
- query: True
- cost: 1
- multivalue: False
geom - None
- type: geometry
- notnull: False
- query: False
- cost: 1
- multivalue: False
meetnet_code - Tot welk meetnet behoort deze filter.
- type: string
- notnull: False
- query: False
- cost: 10
- multivalue: False
- codelist:
0 - 0 - onbekend
1 - 1 - meetnet 1 - primair meetnet - afdeling Water
10 - 10 - meetnet10 - rubriek 55 (verticale boringen)
100 - 100 - meetnet 100 - Geotechniek
11 - 11 - meetnet 11 - rubriek 53.6 (koude-warmtepompen)
12 - 12 - meetnet 12 - lokale besturen
2 - 2 - meetnet 2 - onzekere kwaliteit - afdeling Water
3 - 3 - meetnet 3 - tijdelijk meetnet - afdeling Water
4 - 4 - meetnet 4 - externe instanties
5 - 5 - meetnet 5 - peilputten drinkwatermaatschappijen
6 - 6 - meetnet 6 - peilputten individuele bedrijven
7 - 7 - meetnet 7 - winningsputten
8 - 8 - meetnet 8 - freatisch meetnet - afdeling water
9 - 9 - meetnet 9 - peilputten INBO en natuurorganisaties
edov - edov - meetnet 20 – eDOV erkende boorbedrijven
aquifer_code - De aquifer (watervoerende laag) waarin de filter hangt (code) (HCOVv2)
- type: string
- notnull: False
- query: False
- cost: 10
- multivalue: False
- codelist:
A0000 - A0000 - Onbepaald
A0100 - A0100 - Quartaire Aquifersystemen
A0110 - A0110 - Ophogingen
A0120 - A0120 - Duinen
A0130 - A0130 - Polderafzettingen
A0131 - A0131 - Kleiige polderafzettingen
A0132 - A0132 - Zandige Kreekruggen
A0133 - A0133 - Veen-kleiige poelgronden
A0134 - A0134 - Strandafzettingen***
A0140 - A0140 - Alluviale deklagen
A0150 - A0150 - Eolische deklagen buiten de Roerdalslenk
A0151 - A0151 - Zandige deklagen
A0152 - A0152 - Zand-lemige deklagen
A0153 - A0153 - Lemige deklagen
A0160 - A0160 - Fluvio-eolische deklagen binnen de Roerdalslenk
A0161 - A0161 - Boxtel zand 1
A0162 - A0162 - Boxtel klei 1
A0163 - A0163 - Boxtel zand 2
A0164 - A0164 - Boxtel klei 2
A0165 - A0165 - Boxtel zand 3
A0170 - A0170 - Pleistocene afzettingen
A0180 - A0180 - Maas- en Rijnafzettingen
A0181 - A0181 - Beegden zand 1
A0182 - A0182 - Beegden klei 1
A0183 - A0183 - Beegden zand 2
A0184 - A0184 - Beegden klei 2
A0185 - A0185 - Beegden zand 3
A0186 - A0186 - Beegden ongedifferentieerd
A0187 - A0187 - Sterksel zand 1
A0188 - A0188 - Sterksel klei 1
A0189 - A0189 - Sterksel zand 2
A0200 - A0200 - Kempens Aquifersysteem
A0210 - A0210 - Klei-zand complex van de Kempen
A0220 - A0220 - Pleistoceen en Plioceen Aquifersysteem - west
A0221 - A0221 - Kleiig zand van Malle
A0222 - A0222 - Zand van Merksplas
A0223 - A0223 - Zanden van Zandvliet en Merksem
A0224 - A0224 - Kleiig zand van Kruisschans
A0225 - A0225 - Zanden van Oorderen en Luchtbal
A0226 - A0226 - Ongedifferentieerde zanden van Lillo en Poederlee
A0230 - A0230 - Pleistoceen en Plioceen Aquifersysteem - oost
A0231 - A0231 - Zand van Mol
A0232 - A0232 - Kiezeloöliet zand 1
A0233 - A0233 - Kiezeloöliet klei 1
A0234 - A0234 - Kiezeloöliet zand 2
A0235 - A0235 - Kiezeloöliet klei 2
A0236 - A0236 - Kiezeloöliet zand 3
A0237 - A0237 - Kiezeloöliet klei 3
A0238 - A0238 - Kiezeloöliet zand 4
A0240 - A0240 - Kleiige zanden van Kattendijk en Kasterlee
A0250 - A0250 - Mioceen Aquifersysteem
A0251 - A0251 - Zand van Diest buiten de Roerdalslenk
A0252 - A0252 - Zanden van Diest en Bolderberg binnen de Roerdalslenk
A0253 - A0253 - Zand van Bolderberg buiten de Roerdalslenk
A0254 - A0254 - Zanden van Berchem en Voort buiten de Roerdalslenk
A0255 - A0255 - Voort zand 1
A0256 - A0256 - Voort klei 1
A0257 - A0257 - Voort zand 2
A0258 - A0258 - Zandig deel van Eigenbilzen
A0300 - A0300 - Boom Aquitard
A0301 - A0301 - Kleiig deel van Eigenbilzen
A0302 - A0302 - Klei-silt van Boeretang
A0303 - A0303 - Klei van Putte
A0304 - A0304 - Klei van Terhagen
A0305 - A0305 - Silt van Belsele-Waas
A0400 - A0400 - Oligoceen Aquifersysteem
A0410 - A0410 - Zand van Kerniel
A0420 - A0420 - Klei van Kleine-Spouwen
A0430 - A0430 - Ruisbroek-Berg Aquifer
A0431 - A0431 - Zand van Berg
A0432 - A0432 - Zand van Ruisbroek
A0433 - A0433 - Zand van Kerkom
A0434 - A0434 - Kleiig zand van Alden Biesen
A0440 - A0440 - Tongeren Aquitard
A0441 - A0441 - Klei van Henis
A0442 - A0442 - Zandige klei van Watervliet
A0450 - A0450 - Onder-Oligoceen Aquifersysteem
A0451 - A0451 - Zand van Neerrepen
A0452 - A0452 - Kleiig zand van Grimmertingen
A0453 - A0453 - Kleiig zand van Bassevelde
A0500 - A0500 - Bartoon Aquitardsysteem
A0501 - A0501 - Bartoon klei 1
A0502 - A0502 - Bartoon zand 1
A0503 - A0503 - Bartoon klei 2
A0504 - A0504 - Bartoon zand 2
A0505 - A0505 - Bartoon klei 3
A0600 - A0600 - Ledo Paniseliaan Brusseliaan Aquifersysteem
A0610 - A0610 - Wemmel-Lede Aquifer
A0611 - A0611 - Zand van Wemmel
A0612 - A0612 - Zand van Lede
A0620 - A0620 - Zand van Brussel
A0630 - A0630 - Afzettingen van het Paniseliaan
A0631 - A0631 - Zand van Oedelem
A0632 - A0632 - Zandige klei van Beernem
A0633 - A0633 - Zanden van Aalterbrugge en Vlierzele
A0700 - A0700 - Paniseliaan Aquitardsysteem
A0701 - A0701 - Kleiig zand van Pittem
A0702 - A0702 - Klei van Merelbeke
A0800 - A0800 - Ieperiaan Aquifersysteem
A0801 - A0801 - Zand van Egem
A0802 - A0802 - Klei van Egemkapel
A0803 - A0803 - Silt van Kortemark en zand van Mont-Panisel
A0900 - A0900 - Ieperiaan Aquitardsysteem
A0901 - A0901 - Klei van Aalbeke
A0902 - A0902 - Zandige klei van Roubaix
A0903 - A0903 - Kleiig zand van Mons-en-Pévèle
A0904 - A0904 - Kleien van Orchies, Mont-Héribu en Het Zoute
A1000 - A1000 - Paleoceen Aquifersysteem
A1010 - A1010 - Landeniaan Aquifersysteem
A1011 - A1011 - Zand van Knokke
A1012 - A1012 - Zandige afzettingen van Loksbergen en Dormaal
A1013 - A1013 - Zand van Grandglise
A1020 - A1020 - Landeniaan en Heersiaan Aquitard
A1021 - A1021 - Siltige afzettingen van Halen en Tufsteen van Lincent
A1022 - A1022 - Kleien van Waterschei en Beselare
A1030 - A1030 - Heersiaan en Opglabbeek Aquifersysteem
A1031 - A1031 - Kleiige mergels van Maaseik
A1032 - A1032 - Mergels van Gelinden
A1033 - A1033 - Zand van Orp
A1034 - A1034 - Zand van Eisden
A1035 - A1035 - Klei van Opoeteren
A1100 - A1100 - Krijt Aquifersysteem
A1101 - A1101 - Kalkareniet van Houthem
A1102 - A1102 - Kalkarenieten van Maastricht en Kunrade
A1103 - A1103 - Krijtafzettingen van Gulpen en Nevele, zanden en mergels van Vaals en Dorne en de Turoonmergels
A1104 - A1104 - Zand van Aken
A1200 - A1200 - Jura - Trias - Perm
A1210 - A1210 - Jura (incl. Sleen)
A1220 - A1220 - Trias (excl. Sleen) en Perm
A1300 - A1300 - Sokkel
A1310 - A1310 - Boven-Carboon (steenkoolterrein en -lagen)
A1320 - A1320 - Kolenkalk (incl. Wealdiaan)
A1330 - A1330 - Devoon
A1340 - A1340 - Cambro-Siluur Massief van Brabant
grondwaterlichaam_code -
- type: string
- notnull: False
- query: False
- cost: 10
- multivalue: False
- codelist:
BLKS_0160_GWL_1M - BLKS_0160_GWL_1M - Quartaire Maas- en Rijnafzettingen, freatisch
BLKS_0160_GWL_1S - BLKS_0160_GWL_1S - Pleistoceen Rivierafzettingen, lokaal gespannen
BLKS_0400_GWL_1M - BLKS_0400_GWL_1M - Oligoceen Aquifersysteem, freatisch
BLKS_0400_GWL_1S - BLKS_0400_GWL_1S - Oligoceen Aquifersysteem, lokaal freatisch
BLKS_0400_GWL_2M - BLKS_0400_GWL_2M - Oligoceen Aquifersysteem, gespannen
BLKS_0400_GWL_2S - BLKS_0400_GWL_2S - Oligoceen Aquifersysteem, gespannen
BLKS_0600_GWL_1 - BLKS_0600_GWL_1 - Brusseliaan Aquifer, freatisch
BLKS_0600_GWL_2 - BLKS_0600_GWL_2 - Brusseliaan Aquifer, gespannen
BLKS_0600_GWL_3 - BLKS_0600_GWL_3 - Brusseliaan venster: contact met Diestiaan, lokaal gespannen
BLKS_1000_GWL_1S - BLKS_1000_GWL_1S - Landeniaan Aquifersysteem, lokaal gespannen
BLKS_1000_GWL_2S - BLKS_1000_GWL_2S - Landeniaan Aquifersysteem, gespannen
BLKS_1100_GWL_1M - BLKS_1100_GWL_1M - Krijt Aquifersysteem, freatisch
BLKS_1100_GWL_1S - BLKS_1100_GWL_1S - Krijt Aquifersysteem, freatisch
BLKS_1100_GWL_2M - BLKS_1100_GWL_2M - Krijt Aquifersysteem, gespannen
BLKS_1100_GWL_2S - BLKS_1100_GWL_2S - Krijt Aquifersysteem, gespannen
CKS_0200_GWL_1 - CKS_0200_GWL_1 - Centrale zanden van de Kempen, freatisch
CKS_0200_GWL_2 - CKS_0200_GWL_2 - Noordelijke Zanden van de Kempen, freatisch, plaatselijk semi-freatisch
CKS_0220_GWL_1 - CKS_0220_GWL_1 - Complex van de Kempen, freatisch
CKS_0250_GWL_1 - CKS_0250_GWL_1 - Diestiaangeul: contact Brusseliaan, freatisch
CVS_0100_GWL_1 - CVS_0100_GWL_1 - Dun Quartair dek boven op Paleogeen klei, freatisch
CVS_0160_GWL_1 - CVS_0160_GWL_1 - Pleistoceen afzettingen, freatisch
CVS_0400_GWL_1 - CVS_0400_GWL_1 - Oligoceen Aquifersysteem, lokaal freatisch
CVS_0600_GWL_1 - CVS_0600_GWL_1 - Ledo-Paniseliaan Aquifersysteem, freatisch
CVS_0600_GWL_2 - CVS_0600_GWL_2 - Ledo-Paniseliaan Aquifersysteem, gespannen
CVS_0800_GWL_1 - CVS_0800_GWL_1 - Ieperiaan Aquifer, freatisch
CVS_0800_GWL_2 - CVS_0800_GWL_2 - Ieperiaan Aquifer, gespannen
CVS_0800_GWL_3 - CVS_0800_GWL_3 - Ieperiaan Aquifer Heuvelstreken, lokaal gespannen
KPS_0120_GWL_1 - KPS_0120_GWL_1 - Duin- en kreekgebieden in het kustgebied, freatisch
KPS_0120_GWL_2 - KPS_0120_GWL_2 - Duin- en kreekgebieden in de Oost-Vlaamse Polders, freatisch
KPS_0160_GWL_1 - KPS_0160_GWL_1 - verzilt Quartair en Eoceen van het kustgebied, freatisch
KPS_0160_GWL_2 - KPS_0160_GWL_2 - verzilt Quartair en Oligoceen van Oost-Vlaamse Polders, freatisch
KPS_0160_GWL_3 - KPS_0160_GWL_3 - verzilt Quartair, Plioceen en Mioceen van Scheldepolders, freatisch
MS_0100_GWL_1 - MS_0100_GWL_1 - Quartair Aquifersysteem, freatisch
MS_0200_GWL_1 - MS_0200_GWL_1 - Kempens Aquifersysteem, freatisch, plaatselijk semi-freatisch
MS_0200_GWL_2 - MS_0200_GWL_2 - Kempens Aquifersysteem in de Centrale Slenk, freatisch, plaatselijk semi-freatisch
SS_1000_GWL_1 - SS_1000_GWL_1 - Landeniaan Aquifersysteem, depressietrechter, gespannen
SS_1000_GWL_2 - SS_1000_GWL_2 - Landeniaan Aquifersysteem, gespannen
SS_1300_GWL_1 - SS_1300_GWL_1 - Kolenkalk, gespannen
SS_1300_GWL_2 - SS_1300_GWL_2 - Sokkel + Krijt Aquifersysteem, lokaal freatisch, voedingsgebied
SS_1300_GWL_3 - SS_1300_GWL_3 - Sokkel + Krijt Aquifersysteem, depressietrechter, gespannen
SS_1300_GWL_4 - SS_1300_GWL_4 - Sokkel + Krijt Aquifersysteem, gespannen
SS_1300_GWL_5 - SS_1300_GWL_5 - Sokkel + Krijt Aquifersysteem, depressietrechter, gespannen
X_BLKS_0400_GWL_2 - X_BLKS_0400_GWL_2 - Ten noorden van de grens van het BLKS, in het Oligoceen Aquifersysteem, gespannen
X_BLKS_0600_GWL_2 - X_BLKS_0600_GWL_2 - Ten N van de grens van het BLKS, in de Brusseliaan Aquifer, gespannen
X_BLKS_1000_GWL_2 - X_BLKS_1000_GWL_2 - Ten N van de grens van het BLKS, in het Landeniaan Aquifersysteem, gespannen
X_BLKS_1100_GWL_2 - X_BLKS_1100_GWL_2 - Ten N van de grens van het BLKS, in het Krijt Aquifersysteem, gespannen
meerdere GWL - meerdere GWL - Bevat filters in meerder grondwaterlichamen
onbekend - onbekend - onbekend
regime -
- type: string
- notnull: False
- query: False
- cost: 10
- multivalue: False
datum - Datum waarop de peilmeting uitgevoerd werd.
- type: date
- notnull: False
- query: False
- cost: 10
- multivalue: False
tijdstip - Tijdstip waarop de peilmeting uitgevoerd werd (optioneel).
- type: string
- notnull: False
- query: False
- cost: 10
- multivalue: False
peil_mtaw - Diepte van de peilmeting, uitgedrukt in mTAW.
- type: float
- notnull: False
- query: False
- cost: 10
- multivalue: False
betrouwbaarheid - Betrouwbaarheid van de peilmeting (goed, onbekend of twijfelachtig).
- type: string
- notnull: False
- query: False
- cost: 10
- multivalue: False
methode - Methode waarop de peilmeting uitgevoerd werd.
- type: string
- notnull: False
- query: False
- cost: 10
- multivalue: False
- codelist:
Dieptelood - Dieptelood
Onbekend - Onbekend
andere methode - andere methode
automatische sonde - automatische sonde
borrelbuis - borrelbuis
gemiddelde van loggermetingen - gemiddelde van loggermetingen
manometer - manometer
peillint - peillint
peilmeting onmogelijk - peilmeting onmogelijk
filterstatus - Status van de filter tijdens de peilmeting (in rust - werking).
- type: string
- notnull: False
- query: False
- cost: 10
- multivalue: False
- codelist:
in rust - in rust
onbekend - onbekend
werking - werking
filtertoestand - Filtertoestand bij de peilmeting. Standaardwaarde is '1' = Normaal.
- type: integer
- notnull: False
- query: False
- cost: 10
- multivalue: False
- codelist:
-999 - -999 - Vertrouwelijk (SCK-meting)
-998 - -998 - Past niet in de stijghoogtereeks
-990 - -990 - Verdwenen
-985 - -985 - Infiltratie
-981 - -981 - Buiten bereik Diver (VMW-980)
-980 - -980 - Afpomping
-971 - -971 - "Meting onder filter (VMW-970)"
-970 - -970 - Onder water
-960 - -960 - Loopt over
-950 - -950 - Vervallen
-940 - -940 - Verstopt
-930 - -930 - Beschadigd/defekt
-920 - -920 - Bevroren
-910 - -910 - droog
-905 - -905 - "Geen meting (onbereikbaar)
-903 - -903 - Afgesloten van het net (VMW)
-902 - -902 - Vee in de weide (VMW)
-901 - -901 - Werken aan de put (VMW)
-900 - -900 - Geen waarneming
1 - 1 - normaal
mv_mtaw - Maaiveldhoogte in mTAW op dag dat de put/boring uitgevoerd werd
- type: float
- notnull: False
- query: False
- cost: 10
- multivalue: False
Example use cases
Get groundwater screens in a bounding box
Get data for all the groundwater screens that are geographically located within the bounds of the specified box.
The coordinates are in the Belgian Lambert72 (EPSG:31370) coordinate system and are given in the order of lower left x, lower left y, upper right x, upper right y.
[8]:
from pydov.util.location import Within, Box

df = gwfilter.search(location=Within(Box(93378, 168009, 94246, 169873, epsg=31370)))
df.head()
[000/001] .
[000/026] ..........................
[8]:
| pkey_filter | pkey_grondwaterlocatie | gw_id | filternummer | filtertype | x | y | start_grondwaterlocatie_mtaw | mv_mtaw | gemeente | ... | regime | diepte_onderkant_filter | lengte_filter | datum | tijdstip | peil_mtaw | betrouwbaarheid | methode | filterstatus | filtertoestand | |
|---|---|---|---|---|---|---|---|---|---|---|---|---|---|---|---|---|---|---|---|---|---|
| 0 | https://www.dov.vlaanderen.be/data/filter/1999... | https://www.dov.vlaanderen.be/data/put/2018-00... | SWPP020 | 1 | peilfilter | 93913.0 | 169219.0 | 9.74 | 9.74 | Wortegem-Petegem | ... | onbekend | NaN | NaN | 1999-04-13 | NaN | 9.49 | onbekend | peillint | onbekend | 1.0 |
| 1 | https://www.dov.vlaanderen.be/data/filter/1999... | https://www.dov.vlaanderen.be/data/put/2018-00... | SWPP020 | 1 | peilfilter | 93913.0 | 169219.0 | 9.74 | 9.74 | Wortegem-Petegem | ... | onbekend | NaN | NaN | 1999-04-14 | NaN | 9.74 | onbekend | peillint | onbekend | 1.0 |
| 2 | https://www.dov.vlaanderen.be/data/filter/1999... | https://www.dov.vlaanderen.be/data/put/2018-00... | SWPP020 | 1 | peilfilter | 93913.0 | 169219.0 | 9.74 | 9.74 | Wortegem-Petegem | ... | onbekend | NaN | NaN | 1999-04-22 | NaN | 9.74 | onbekend | peillint | onbekend | 1.0 |
| 3 | https://www.dov.vlaanderen.be/data/filter/1999... | https://www.dov.vlaanderen.be/data/put/2018-00... | SWPP020 | 1 | peilfilter | 93913.0 | 169219.0 | 9.74 | 9.74 | Wortegem-Petegem | ... | onbekend | NaN | NaN | 1999-05-06 | NaN | 9.74 | onbekend | peillint | onbekend | 1.0 |
| 4 | https://www.dov.vlaanderen.be/data/filter/1999... | https://www.dov.vlaanderen.be/data/put/2018-00... | SWPP020 | 1 | peilfilter | 93913.0 | 169219.0 | 9.74 | 9.74 | Wortegem-Petegem | ... | onbekend | NaN | NaN | 1999-05-18 | NaN | 9.70 | onbekend | peillint | onbekend | 1.0 |
5 rows × 23 columns
Using the pkey attributes one can request the details of the corresponding put or filter in a webbrowser:
[9]:
for pkey_grondwaterlocatie in set(df.pkey_grondwaterlocatie):
    print(pkey_grondwaterlocatie)

for pkey_filter in set(df.pkey_filter):
    print(pkey_filter)
https://www.dov.vlaanderen.be/data/put/2018-007290
https://www.dov.vlaanderen.be/data/put/2018-007287
https://www.dov.vlaanderen.be/data/put/2018-007300
https://www.dov.vlaanderen.be/data/put/2019-019725
https://www.dov.vlaanderen.be/data/put/2018-007293
https://www.dov.vlaanderen.be/data/put/2018-007295
https://www.dov.vlaanderen.be/data/put/2018-007305
https://www.dov.vlaanderen.be/data/put/2019-020544
https://www.dov.vlaanderen.be/data/put/2018-007289
https://www.dov.vlaanderen.be/data/put/2018-007313
https://www.dov.vlaanderen.be/data/put/2018-007292
https://www.dov.vlaanderen.be/data/put/2018-007311
https://www.dov.vlaanderen.be/data/put/2017-002867
https://www.dov.vlaanderen.be/data/put/2018-007299
https://www.dov.vlaanderen.be/data/put/2018-007291
https://www.dov.vlaanderen.be/data/put/2018-007304
https://www.dov.vlaanderen.be/data/put/2017-002866
https://www.dov.vlaanderen.be/data/put/2018-007288
https://www.dov.vlaanderen.be/data/put/2017-002868
https://www.dov.vlaanderen.be/data/put/2018-007307
https://www.dov.vlaanderen.be/data/put/2018-007286
https://www.dov.vlaanderen.be/data/put/2018-007285
https://www.dov.vlaanderen.be/data/put/2018-007310
https://www.dov.vlaanderen.be/data/put/2018-007294
https://www.dov.vlaanderen.be/data/put/2018-007296
https://www.dov.vlaanderen.be/data/put/2018-007312
https://www.dov.vlaanderen.be/data/filter/1999-011029
https://www.dov.vlaanderen.be/data/filter/1999-011004
https://www.dov.vlaanderen.be/data/filter/1999-011011
https://www.dov.vlaanderen.be/data/filter/1999-011014
https://www.dov.vlaanderen.be/data/filter/1999-011013
https://www.dov.vlaanderen.be/data/filter/2007-011018
https://www.dov.vlaanderen.be/data/filter/1999-000607
https://www.dov.vlaanderen.be/data/filter/1999-000606
https://www.dov.vlaanderen.be/data/filter/1995-061303
https://www.dov.vlaanderen.be/data/filter/1999-011008
https://www.dov.vlaanderen.be/data/filter/2007-011024
https://www.dov.vlaanderen.be/data/filter/1999-011007
https://www.dov.vlaanderen.be/data/filter/1999-011010
https://www.dov.vlaanderen.be/data/filter/1999-011005
https://www.dov.vlaanderen.be/data/filter/1999-000605
https://www.dov.vlaanderen.be/data/filter/1999-011006
https://www.dov.vlaanderen.be/data/filter/2007-011019
https://www.dov.vlaanderen.be/data/filter/1999-011032
https://www.dov.vlaanderen.be/data/filter/1999-011015
https://www.dov.vlaanderen.be/data/filter/1999-011031
https://www.dov.vlaanderen.be/data/filter/2009-011026
https://www.dov.vlaanderen.be/data/filter/1991-062098
https://www.dov.vlaanderen.be/data/filter/1999-011030
https://www.dov.vlaanderen.be/data/filter/1999-011009
https://www.dov.vlaanderen.be/data/filter/1999-011012
https://www.dov.vlaanderen.be/data/filter/2007-011023
Get groundwater screens with specific properties
Next to querying groundwater screens based on their geographic location within a bounding box, we can also search for groundwater screens matching a specific set of properties. For this we can build a query using a combination of the ‘GrondwaterFilter’ fields and operators provided by the WFS protocol.
A list of possible operators can be found below:
[10]:
[i for i,j in inspect.getmembers(sys.modules['owslib.fes2'], inspect.isclass) if 'Property' in i]
[10]:
['PropertyIsBetween',
 'PropertyIsEqualTo',
 'PropertyIsGreaterThan',
 'PropertyIsGreaterThanOrEqualTo',
 'PropertyIsLessThan',
 'PropertyIsLessThanOrEqualTo',
 'PropertyIsLike',
 'PropertyIsNotEqualTo',
 'PropertyIsNull',
 'SortProperty']
In this example we build a query using the PropertyIsEqualTo operator to find all groundwater screens that are within the community (gemeente) of ‘Hamme’:
[11]:
from owslib.fes2 import PropertyIsEqualTo

query = PropertyIsEqualTo(
            propertyname='gemeente',
            literal='Herstappe')

df = gwfilter.search(query=query)
df.head()
[000/001] .
[000/002] ..
[11]:
| pkey_filter | pkey_grondwaterlocatie | gw_id | filternummer | filtertype | x | y | start_grondwaterlocatie_mtaw | mv_mtaw | gemeente | ... | regime | diepte_onderkant_filter | lengte_filter | datum | tijdstip | peil_mtaw | betrouwbaarheid | methode | filterstatus | filtertoestand | |
|---|---|---|---|---|---|---|---|---|---|---|---|---|---|---|---|---|---|---|---|---|---|
| 0 | https://www.dov.vlaanderen.be/data/filter/1993... | https://www.dov.vlaanderen.be/data/put/2019-02... | 7-001016 | 1 | pompfilter | 224798.0 | 157819.0 | 130.80 | 130.80 | Herstappe | ... | freatisch | 45.0 | 5.0 | NaN | NaN | NaN | NaN | NaN | NaN | NaN |
| 1 | https://www.dov.vlaanderen.be/data/filter/1900... | https://www.dov.vlaanderen.be/data/put/2019-05... | 7-97027 | 1 | pompfilter | 224843.0 | 157842.0 | 132.09 | 132.09 | Herstappe | ... | onbekend | NaN | NaN | NaN | NaN | NaN | NaN | NaN | NaN | NaN |
2 rows × 23 columns
Once again we can use the pkey_filter as a permanent link to the information of the groundwater screens:
[12]:
for pkey_filter in set(df.pkey_filter):
    print(pkey_filter)
https://www.dov.vlaanderen.be/data/filter/1900-050992
https://www.dov.vlaanderen.be/data/filter/1993-065801
Get the coordinates of all groundwater screens in Ghent
[13]:
query = PropertyIsEqualTo(propertyname='gemeente',
                          literal='Gent')

df = gwfilter.search(query=query,
                     return_fields=('pkey_filter', 'x', 'y', 'meetnet'))
df.head()
[000/001] .
[13]:
| pkey_filter | x | y | meetnet | |
|---|---|---|---|---|
| 0 | https://www.dov.vlaanderen.be/data/filter/1997... | 106124.00 | 199042.00 | meetnet 7 - winningsputten |
| 1 | https://www.dov.vlaanderen.be/data/filter/2025... | 101458.94 | 190074.92 | meetnet 100 - Geotechniek |
| 2 | https://www.dov.vlaanderen.be/data/filter/1999... | 109236.00 | 192894.00 | meetnet 9 - peilputten INBO en natuurorganisaties |
| 3 | https://www.dov.vlaanderen.be/data/filter/1998... | 109642.00 | 208006.00 | meetnet 7 - winningsputten |
| 4 | https://www.dov.vlaanderen.be/data/filter/1999... | 109264.00 | 192359.00 | meetnet 9 - peilputten INBO en natuurorganisaties |
Get the ‘meetnet’ and ‘meetnet_code’ for groundwater screens in Boortmeerbeek
[14]:
query = PropertyIsEqualTo(propertyname='gemeente',
                          literal='Boortmeerbeek')

df = gwfilter.search(query=query,
                   return_fields=('pkey_filter', 'meetnet', 'meetnet_code'))
df.head()
[000/001] .
[000/062] ..................................................
[050/062] ............
[14]:
| pkey_filter | meetnet | meetnet_code | |
|---|---|---|---|
| 0 | https://www.dov.vlaanderen.be/data/filter/1969... | meetnet 7 - winningsputten | 7 |
| 1 | https://www.dov.vlaanderen.be/data/filter/2006... | meetnet 9 - peilputten INBO en natuurorganisaties | 9 |
| 2 | https://www.dov.vlaanderen.be/data/filter/1900... | meetnet 3 - tijdelijk meetnet - afdeling Water | 3 |
| 3 | https://www.dov.vlaanderen.be/data/filter/1979... | meetnet 7 - winningsputten | 7 |
| 4 | https://www.dov.vlaanderen.be/data/filter/2004... | meetnet 7 - winningsputten | 7 |
Get all details of groundwaterscreens of ‘meetnet 9’ within the given bounding box
[15]:
from owslib.fes2 import PropertyIsLike

query = PropertyIsLike(propertyname='meetnet',
                       literal='meetnet 9 %')
df = gwfilter.search(query=query,
                     location=Within(Box(87676, 163442, 91194, 168043, epsg=31370)))
df.head()
[000/001] .
[000/017] .................
[15]:
| pkey_filter | pkey_grondwaterlocatie | gw_id | filternummer | filtertype | x | y | start_grondwaterlocatie_mtaw | mv_mtaw | gemeente | ... | regime | diepte_onderkant_filter | lengte_filter | datum | tijdstip | peil_mtaw | betrouwbaarheid | methode | filterstatus | filtertoestand | |
|---|---|---|---|---|---|---|---|---|---|---|---|---|---|---|---|---|---|---|---|---|---|
| 0 | https://www.dov.vlaanderen.be/data/filter/2002... | https://www.dov.vlaanderen.be/data/put/2019-09... | WVSP028 | 1 | peilfilter | 89779.0 | 165983.0 | 11.41 | 11.41 | Avelgem | ... | NaN | NaN | NaN | NaN | NaN | NaN | NaN | NaN | NaN | NaN |
| 1 | https://www.dov.vlaanderen.be/data/filter/2000... | https://www.dov.vlaanderen.be/data/put/2019-09... | PBRP003 | 1 | peilfilter | 90313.0 | 164385.0 | 14.34 | 14.34 | Kluisbergen | ... | NaN | NaN | NaN | NaN | NaN | NaN | NaN | NaN | NaN | NaN |
| 2 | https://www.dov.vlaanderen.be/data/filter/2000... | https://www.dov.vlaanderen.be/data/put/2019-09... | PBRP007 | 1 | peilfilter | 90234.0 | 164282.0 | 14.38 | 14.38 | Kluisbergen | ... | NaN | NaN | NaN | NaN | NaN | NaN | NaN | NaN | NaN | NaN |
| 3 | https://www.dov.vlaanderen.be/data/filter/2000... | https://www.dov.vlaanderen.be/data/put/2019-09... | PBRP005 | 1 | peilfilter | 90234.0 | 164282.0 | 14.38 | 14.38 | Kluisbergen | ... | NaN | NaN | NaN | NaN | NaN | NaN | NaN | NaN | NaN | NaN |
| 4 | https://www.dov.vlaanderen.be/data/filter/2000... | https://www.dov.vlaanderen.be/data/put/2019-09... | PBRP002 | 1 | peilfilter | 90313.0 | 164385.0 | 14.34 | 14.34 | Kluisbergen | ... | NaN | NaN | NaN | NaN | NaN | NaN | NaN | NaN | NaN | NaN |
5 rows × 23 columns
Get groundwater screens based on a combination of specific properties
Get all groundwater screens in Hamme that have a value for length_filter and either belong to the primary meetnet of VMM or that have a depth bottom screen less than 3 meter.
[16]:
from owslib.fes2 import Or, Not, PropertyIsNull, PropertyIsLessThanOrEqualTo, And

query = And([PropertyIsEqualTo(propertyname='gemeente',
                               literal='Hamme'),
             Not([PropertyIsNull(propertyname='lengte_filter')]),
             Or([PropertyIsLike(propertyname='meetnet',
                                literal='meetnet 1%'),
                 PropertyIsLessThanOrEqualTo(
                     propertyname='diepte_onderkant_filter',
                     literal='3')])])
df_hamme = gwfilter.search(query=query,
                     return_fields=('pkey_filter', 'x', 'y', 'gw_id', 'filternummer', 'diepte_onderkant_filter'))
df_hamme.head()
[000/001] .
[16]:
| pkey_filter | x | y | gw_id | filternummer | diepte_onderkant_filter | |
|---|---|---|---|---|---|---|
| 0 | https://www.dov.vlaanderen.be/data/filter/2006... | 137459.00000 | 193510.000000 | GWZP010 | 1 | 1.93 |
| 1 | https://www.dov.vlaanderen.be/data/filter/2006... | 137181.00000 | 193667.000000 | GWZP007 | 1 | 1.89 |
| 2 | https://www.dov.vlaanderen.be/data/filter/2006... | 136895.00000 | 192591.000000 | GWZP004 | 1 | 2.55 |
| 3 | https://www.dov.vlaanderen.be/data/filter/2003... | 131837.65625 | 197054.203125 | 810/21/1 | 1 | 2.50 |
| 4 | https://www.dov.vlaanderen.be/data/filter/2004... | 128749.00000 | 199574.000000 | DURP016 | 1 | 2.38 |
Combine datum and tijdstip in a datetime object
Get some data and keep only the relevant waterlevel measurements:
[17]:
query = PropertyIsEqualTo(
            propertyname='pkey_filter',
            literal='https://www.dov.vlaanderen.be/data/filter/1997-000494')

df = gwfilter.search(query=query)
df = df[df.filterstatus == "in rust"]
[000/001] .
[000/001] .
If the tijdstip field contains data, it can be combined with the datum field to create a date.datetime object. Make sure to fill the empty tijdstip fields with a default timestamp.
[18]:
import pandas as pd
df.reset_index(inplace=True)
df['tijdstip'] = df.tijdstip.fillna('00:00:00')
df['tijd'] = pd.to_datetime(df.datum.astype(str)+' '+df.tijdstip.astype(str))
df.tijd.head()
[18]:
0   1998-07-31 01:05:00
1   1999-01-16 15:01:00
2   1999-08-14 01:05:00
3   1999-11-14 02:40:00
4   1999-12-27 00:01:00
Name: tijd, dtype: datetime64[ns]
Working with water head time series
For further analysis and visualisation of the time series data, we can use the data analysis library pandas and visualisation library matplotlib.
[19]:
import pandas as pd
import matplotlib.pyplot as plt
Query the data of a specific filter using its pkey:
[20]:
query = PropertyIsEqualTo(
            propertyname='pkey_filter',
            literal='https://www.dov.vlaanderen.be/data/filter/2003-009883')

df = gwfilter.search(query=query)
df.head()
[000/001] .
[000/001] .
[20]:
| pkey_filter | pkey_grondwaterlocatie | gw_id | filternummer | filtertype | x | y | start_grondwaterlocatie_mtaw | mv_mtaw | gemeente | ... | regime | diepte_onderkant_filter | lengte_filter | datum | tijdstip | peil_mtaw | betrouwbaarheid | methode | filterstatus | filtertoestand | |
|---|---|---|---|---|---|---|---|---|---|---|---|---|---|---|---|---|---|---|---|---|---|
| 0 | https://www.dov.vlaanderen.be/data/filter/2003... | https://www.dov.vlaanderen.be/data/put/2018-00... | ZWAP205 | 1 | peilfilter | 218953.0 | 198767.0 | 58.48 | 58.48 | Houthalen-Helchteren | ... | onbekend | 0.72 | 0.3 | 2003-10-18 | NaN | 58.26 | onbekend | peillint | onbekend | 1 |
| 1 | https://www.dov.vlaanderen.be/data/filter/2003... | https://www.dov.vlaanderen.be/data/put/2018-00... | ZWAP205 | 1 | peilfilter | 218953.0 | 198767.0 | 58.48 | 58.48 | Houthalen-Helchteren | ... | onbekend | 0.72 | 0.3 | 2003-11-01 | NaN | 58.30 | onbekend | peillint | onbekend | 1 |
| 2 | https://www.dov.vlaanderen.be/data/filter/2003... | https://www.dov.vlaanderen.be/data/put/2018-00... | ZWAP205 | 1 | peilfilter | 218953.0 | 198767.0 | 58.48 | 58.48 | Houthalen-Helchteren | ... | onbekend | 0.72 | 0.3 | 2003-11-17 | NaN | 58.31 | onbekend | peillint | onbekend | 1 |
| 3 | https://www.dov.vlaanderen.be/data/filter/2003... | https://www.dov.vlaanderen.be/data/put/2018-00... | ZWAP205 | 1 | peilfilter | 218953.0 | 198767.0 | 58.48 | 58.48 | Houthalen-Helchteren | ... | onbekend | 0.72 | 0.3 | 2003-11-23 | NaN | 58.31 | onbekend | peillint | onbekend | 1 |
| 4 | https://www.dov.vlaanderen.be/data/filter/2003... | https://www.dov.vlaanderen.be/data/put/2018-00... | ZWAP205 | 1 | peilfilter | 218953.0 | 198767.0 | 58.48 | 58.48 | Houthalen-Helchteren | ... | onbekend | 0.72 | 0.3 | 2003-12-14 | NaN | 58.30 | onbekend | peillint | onbekend | 1 |
5 rows × 23 columns
The date is still stored as a string type. Transforming to a data type using the available pandas function `to_datetime <https://pandas.pydata.org/pandas-docs/stable/generated/pandas.to_datetime.html>`__ and using these dates as row index:
[21]:
df['datum'] = pd.to_datetime(df['datum'])
df = df.set_index('datum')
Plotting
The default plotting functionality of Pandas can be used:
[22]:
df.head()
[22]:
| pkey_filter | pkey_grondwaterlocatie | gw_id | filternummer | filtertype | x | y | start_grondwaterlocatie_mtaw | mv_mtaw | gemeente | ... | grondwaterlichaam_code | regime | diepte_onderkant_filter | lengte_filter | tijdstip | peil_mtaw | betrouwbaarheid | methode | filterstatus | filtertoestand | |
|---|---|---|---|---|---|---|---|---|---|---|---|---|---|---|---|---|---|---|---|---|---|
| datum | |||||||||||||||||||||
| 2003-10-18 | https://www.dov.vlaanderen.be/data/filter/2003... | https://www.dov.vlaanderen.be/data/put/2018-00... | ZWAP205 | 1 | peilfilter | 218953.0 | 198767.0 | 58.48 | 58.48 | Houthalen-Helchteren | ... | NaN | onbekend | 0.72 | 0.3 | NaN | 58.26 | onbekend | peillint | onbekend | 1 |
| 2003-11-01 | https://www.dov.vlaanderen.be/data/filter/2003... | https://www.dov.vlaanderen.be/data/put/2018-00... | ZWAP205 | 1 | peilfilter | 218953.0 | 198767.0 | 58.48 | 58.48 | Houthalen-Helchteren | ... | NaN | onbekend | 0.72 | 0.3 | NaN | 58.30 | onbekend | peillint | onbekend | 1 |
| 2003-11-17 | https://www.dov.vlaanderen.be/data/filter/2003... | https://www.dov.vlaanderen.be/data/put/2018-00... | ZWAP205 | 1 | peilfilter | 218953.0 | 198767.0 | 58.48 | 58.48 | Houthalen-Helchteren | ... | NaN | onbekend | 0.72 | 0.3 | NaN | 58.31 | onbekend | peillint | onbekend | 1 |
| 2003-11-23 | https://www.dov.vlaanderen.be/data/filter/2003... | https://www.dov.vlaanderen.be/data/put/2018-00... | ZWAP205 | 1 | peilfilter | 218953.0 | 198767.0 | 58.48 | 58.48 | Houthalen-Helchteren | ... | NaN | onbekend | 0.72 | 0.3 | NaN | 58.31 | onbekend | peillint | onbekend | 1 |
| 2003-12-14 | https://www.dov.vlaanderen.be/data/filter/2003... | https://www.dov.vlaanderen.be/data/put/2018-00... | ZWAP205 | 1 | peilfilter | 218953.0 | 198767.0 | 58.48 | 58.48 | Houthalen-Helchteren | ... | NaN | onbekend | 0.72 | 0.3 | NaN | 58.30 | onbekend | peillint | onbekend | 1 |
5 rows × 22 columns
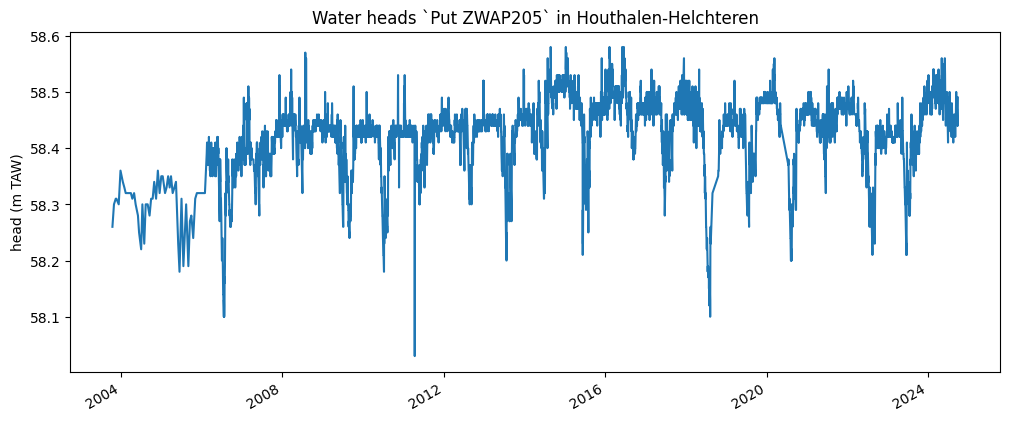
[23]:
ax = df['peil_mtaw'].plot(style='-', figsize=(12, 5))
ax.set_title('Water heads `Put ZWAP205` in Houthalen-Helchteren');
ax.set_ylabel('head (m TAW)');
ax.set_xlabel('');
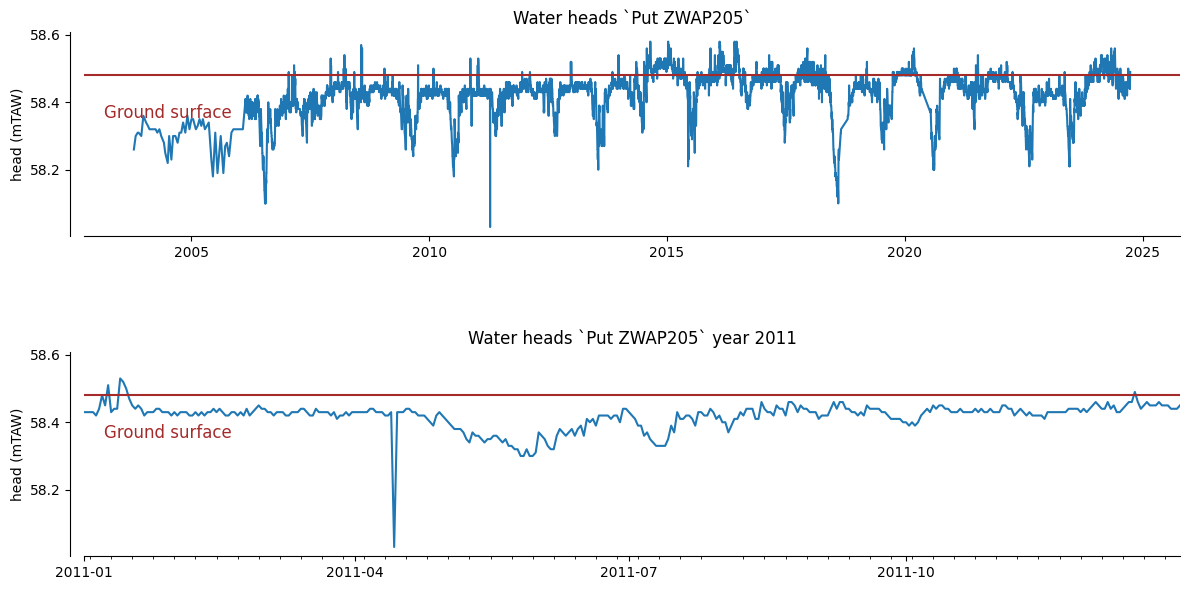
Or a combination with matplotlib to have full customization options:
[24]:
from matplotlib.dates import MonthLocator, YearLocator, DateFormatter
from matplotlib.ticker import MaxNLocator, MultipleLocator

# Get height of ground surface
ground_surface = df["mv_mtaw"][0]

# create a plot with 2 subplots
fig, (ax1, ax2) = plt.subplots(2, 1, figsize=(12, 6),
                               sharex=False, sharey=True)

# Plot entire time series in the upper plot
df['peil_mtaw'].plot(ax=ax1, title='Water heads `Put ZWAP205`')
ax1.xaxis.set_major_locator(YearLocator(5))
ax1.xaxis.set_major_formatter(DateFormatter('%Y'))

# Plot the data for 2011 in the lower plot
df['peil_mtaw']["2011"].plot(ax=ax2,  title='Water heads `Put ZWAP205` year 2011')
ax2.xaxis.set_major_locator(MonthLocator(interval=3))
ax2.xaxis.set_major_formatter(DateFormatter('%Y-%m'))

# Adjust configuration of plot
for ax in (ax1, ax2):
    ax.set_xlabel('')
    ax.set_ylabel('head (mTAW)')
    for tick in ax.get_xticklabels():
        tick.set_rotation(0)
        tick.set_horizontalalignment('center')

    # Only draw spine between the y-ticks
    ax.spines['left'].set_position(('outward', 10))
    # Hide the right and top spines
    ax.spines['right'].set_visible(False)
    ax.spines['top'].set_visible(False)
    ax.yaxis.set_major_locator(MultipleLocator(0.2))

    # Add the ground surface (provided in the data) on the subplots
    ax.axhline(ground_surface, color = 'brown')
    ax.annotate('Ground surface',
             xy=(0.05, 0.68),
             xycoords='axes fraction',
             xytext=(-25, -15), textcoords='offset points',
             fontsize=12, color='brown')

fig.tight_layout(h_pad=5)
/tmp/ipykernel_11791/3156484461.py:5: FutureWarning: Series.__getitem__ treating keys as positions is deprecated. In a future version, integer keys will always be treated as labels (consistent with DataFrame behavior). To access a value by position, use `ser.iloc[pos]`
  ground_surface = df["mv_mtaw"][0]
Analysis
The Pandas package provides a the functionality to further analyze and process time series data. Particularly, the `resample <https://pandas.pydata.org/pandas-docs/stable/generated/pandas.DataFrame.resample.html>`__ function can be useful.
For example, calculate the yearly minima and maxima of the time series:
[25]:
df["peil_mtaw"].resample("A").agg(['min', 'max'])
/tmp/ipykernel_11791/3158431998.py:1: FutureWarning: 'A' is deprecated and will be removed in a future version, please use 'YE' instead.
  df["peil_mtaw"].resample("A").agg(['min', 'max'])
[25]:
| min | max | |
|---|---|---|
| datum | ||
| 2003-12-31 | 58.26 | 58.36 |
| 2004-12-31 | 58.22 | 58.36 |
| 2005-12-31 | 58.18 | 58.35 |
| 2006-12-31 | 58.10 | 58.42 |
| 2007-12-31 | 58.28 | 58.53 |
| 2008-12-31 | 58.32 | 58.57 |
| 2009-12-31 | 58.24 | 58.51 |
| 2010-12-31 | 58.18 | 58.53 |
| 2011-12-31 | 58.03 | 58.53 |
| 2012-12-31 | 58.30 | 58.52 |
| 2013-12-31 | 58.20 | 58.54 |
| 2014-12-31 | 58.31 | 58.58 |
| 2015-12-31 | 58.21 | 58.58 |
| 2016-12-31 | 58.38 | 58.58 |
| 2017-12-31 | 58.28 | 58.56 |
| 2018-12-31 | 58.10 | 58.54 |
| 2019-12-31 | 58.26 | 58.52 |
| 2020-12-31 | 58.20 | 58.56 |
| 2021-12-31 | 58.32 | 58.54 |
| 2022-12-31 | 58.21 | 58.52 |
| 2023-12-31 | 58.21 | 58.52 |
| 2024-12-31 | 58.41 | 58.56 |
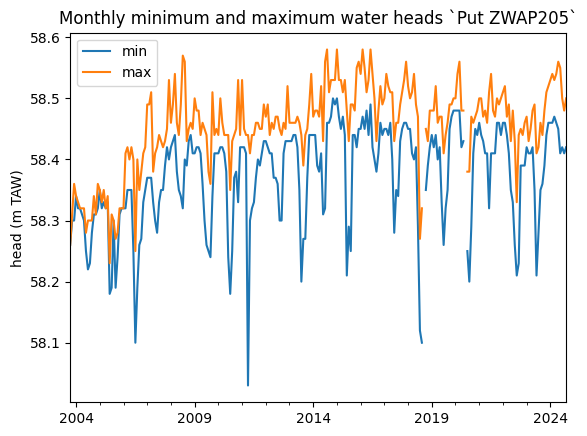
or the monthly minima and maxima:
[26]:
ax = df["peil_mtaw"].resample("M").agg(['min', 'max']).plot()
ax.set_title('Monthly minimum and maximum water heads `Put ZWAP205`');
ax.set_ylabel('head (m TAW)');
ax.set_xlabel('');
/tmp/ipykernel_11791/1348260655.py:1: FutureWarning: 'M' is deprecated and will be removed in a future version, please use 'ME' instead.
  ax = df["peil_mtaw"].resample("M").agg(['min', 'max']).plot()
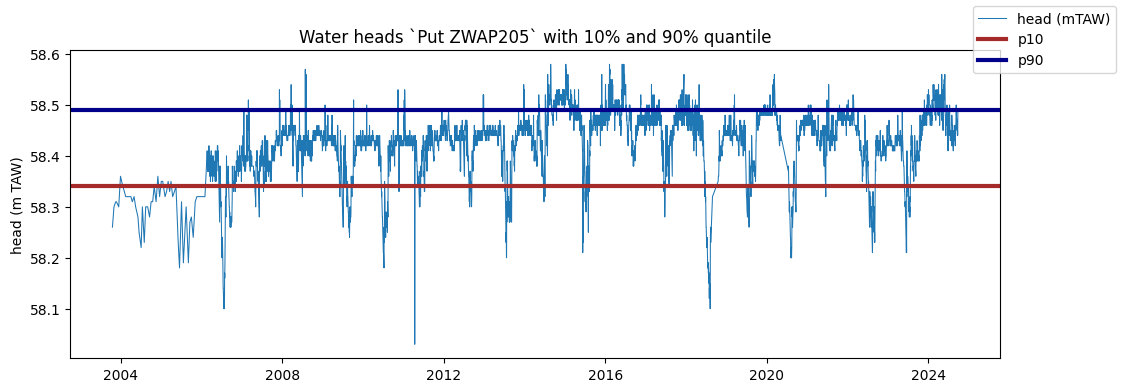
Calculate 10 and 90 percentiles of the time series with the quantile function:
[27]:
fig, ax = plt.subplots(figsize=(12, 4))
ax.plot(df["peil_mtaw"], label='head (mTAW)', linewidth=0.75)

ax.axhline(df["peil_mtaw"].quantile(0.1), color = 'brown', label='p10', linewidth=3)
ax.axhline(df["peil_mtaw"].quantile(0.9), color = 'darkblue', label='p90', linewidth=3)
handles, labels = ax.get_legend_handles_labels()

ax.set_title('Water heads `Put ZWAP205` with 10% and 90% quantile');
ax.set_ylabel('head (m TAW)');
ax.set_xlabel('');

fig.legend(handles, labels)
[27]:
<matplotlib.legend.Legend at 0x7f9fa9606850>
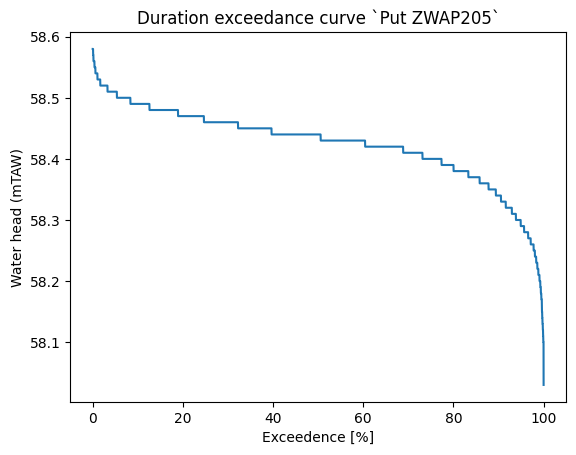
A duration exceedance curve provides the percentage of time that the water head is above a given value:
[28]:
import numpy as np
[29]:
sorted_heads = np.sort(df["peil_mtaw"])[::-1]
exceedence = np.arange(1.,len(sorted_heads)+1) / len(sorted_heads)

fig, ax = plt.subplots()
ax.plot(exceedence*100, sorted_heads)
ax.set_xlabel("Exceedence [%]");
ax.set_ylabel("Water head (mTAW)");
ax.set_title("Duration exceedance curve `Put ZWAP205`");
Visualize locations
Using Folium, we can display the results of our search on a map.
[30]:
# import the necessary modules (not included in the requirements of pydov!)
import folium
from folium.plugins import MarkerCluster
from pyproj import Transformer
[31]:
# convert the coordinates to lat/lon for folium
def convert_latlon(x1, y1):
    transformer = Transformer.from_crs("epsg:31370", "epsg:4326", always_xy=True)
    x2,y2 = transformer.transform(x1, y1)
    return x2, y2

df_hamme['lon'], df_hamme['lat'] = zip(*map(convert_latlon, df_hamme['x'], df_hamme['y']))
# convert to list
loclist = df_hamme[['lat', 'lon']].values.tolist()
[32]:
# initialize the Folium map on the centre of the selected locations, play with the zoom until ok
fmap = folium.Map(location=[df_hamme['lat'].mean(), df_hamme['lon'].mean()], zoom_start=12)
marker_cluster = MarkerCluster().add_to(fmap)
for loc in range(0, len(loclist)):
    folium.Marker(loclist[loc], popup=df_hamme['gw_id'][loc]).add_to(marker_cluster)
fmap
[32]:
Get groundwater screens within a “grondwaterlichaam”
[33]:
gwfilter = GrondwaterFilterSearch()
[34]:
query = PropertyIsLike(
            propertyname='grondwaterlichaam',
            literal='BLKS_1000%')
df = gwfilter.search(max_features=10,
                     query=query,
                     return_fields=("pkey_filter", "gw_id", "filternummer", "x", "y", "grondwaterlichaam_code"))
df
[000/001] .
[000/010] ..........
[34]:
| pkey_filter | gw_id | filternummer | x | y | grondwaterlichaam_code | |
|---|---|---|---|---|---|---|
| 0 | https://www.dov.vlaanderen.be/data/filter/2003... | 620/76/17 | 3 | 199254.58 | 162047.33 | BLKS_1000_GWL_1S |
| 1 | https://www.dov.vlaanderen.be/data/filter/2011... | 2-93613 | 1 | 194226.00 | 169852.00 | BLKS_1000_GWL_1S |
| 2 | https://www.dov.vlaanderen.be/data/filter/1995... | 2-000122 | 1 | 189724.90 | 170211.80 | BLKS_1000_GWL_2S |
| 3 | https://www.dov.vlaanderen.be/data/filter/2015... | 7-101124 | 2 | 229414.00 | 174604.00 | BLKS_1000_GWL_2S |
| 4 | https://www.dov.vlaanderen.be/data/filter/1900... | 2-106436 | 1 | 199712.00 | 166782.00 | BLKS_1000_GWL_1S |
| 5 | https://www.dov.vlaanderen.be/data/filter/1900... | 2-100236 | 1 | 201770.00 | 162472.00 | BLKS_1000_GWL_1S |
| 6 | https://www.dov.vlaanderen.be/data/filter/1900... | 7-104336 | 1 | 207815.00 | 165898.00 | BLKS_1000_GWL_1S |
| 7 | https://www.dov.vlaanderen.be/data/filter/1900... | 7-102996 | 1 | 220481.00 | 165697.00 | BLKS_1000_GWL_2S |
| 8 | https://www.dov.vlaanderen.be/data/filter/2003... | 620/72/10 | 3 | 202242.33 | 164202.26 | BLKS_1000_GWL_1S |
| 9 | https://www.dov.vlaanderen.be/data/filter/1900... | 2-100235 | 1 | 198412.00 | 162379.00 | BLKS_1000_GWL_1S |
List yearly average water head levels (GxG)
For some of our Grondwaterfilters precalculated groundwaterlevel statistics (GxG) are available next to the individual measurements (peilmetingen) themselves. These statistics give information about the average high, low and medium groundwater levels at that location, per calendar year.
This data is available in a separate subtype Gxg.
To check the available subtypes for a the GrondwaterFilter type, you can use:
[35]:
from pydov.types.grondwaterfilter import GrondwaterFilter

GrondwaterFilter.get_subtypes()
[35]:
{'Gxg': {'name': 'Gxg',
  'class': pydov.types.grondwaterfilter.Gxg,
  'definition': 'Subtype listing the GxG values or precalculated groundwaterlevel\nstatistics. It has the following fields: gxg_jaar, gxg_hg3, gxg_lg3, gxg_vg3.'},
 'Peilmeting': {'name': 'Peilmeting',
  'class': pydov.types.grondwaterfilter.Peilmeting,
  'definition': 'Subtype listing the water head level measurements. It has the following fields: datum, tijdstip, peil_mtaw, betrouwbaarheid, methode, filterstatus, filtertoestand.'}}
To retrieve the GxG values, we can instantiate the search class with the Gxg subtype:
[36]:
from pydov.search.grondwaterfilter import GrondwaterFilterSearch
from pydov.types.grondwaterfilter import Gxg

grondwaterfilter_search = GrondwaterFilterSearch(
    objecttype=GrondwaterFilter.with_subtype(Gxg)
)
The extra fields are now available, and should be included in the output of get_fields(). E.g. to get more details about the gxg_vg3 field:
[37]:
grondwaterfilter_search.get_fields()['gxg_vg3']
[37]:
gxg_vg3 - gemiddelde van de grondwaterstanden op 14 maart, 28 maart en 14 april in een bepaald kalenderjaar
- type: float
- notnull: False
- query: False
- cost: 10
- multivalue: False
And this data is returned when querying:
[38]:
grondwaterfilter_search.search(query=PropertyIsEqualTo('pkey_filter', 'https://www.dov.vlaanderen.be/data/filter/1996-011637'))
[000/001] .
[000/001] c
[38]:
| pkey_filter | pkey_grondwaterlocatie | gw_id | filternummer | filtertype | x | y | start_grondwaterlocatie_mtaw | mv_mtaw | gemeente | meetnet_code | aquifer_code | grondwaterlichaam_code | regime | diepte_onderkant_filter | lengte_filter | gxg_jaar | gxg_hg3 | gxg_lg3 | gxg_vg3 | |
|---|---|---|---|---|---|---|---|---|---|---|---|---|---|---|---|---|---|---|---|---|
| 0 | https://www.dov.vlaanderen.be/data/filter/1996... | https://www.dov.vlaanderen.be/data/put/2018-00... | SNOP039 | 1 | peilfilter | 182987.0 | 169274.0 | 57.87 | 57.87 | Boutersem | 9 | A0000 | NaN | onbekend | NaN | NaN | NaN | NaN | NaN | NaN |